library(ggplot2)
ggplot(data = mtcars)
Providing only data will results in a empty plot:
library(ggplot2)
ggplot(data = mtcars)
so add an aesthetic. The plot will still be empty since no geom is added.
ggplot(data = mtcars, mapping = aes(x = mpg, y = disp))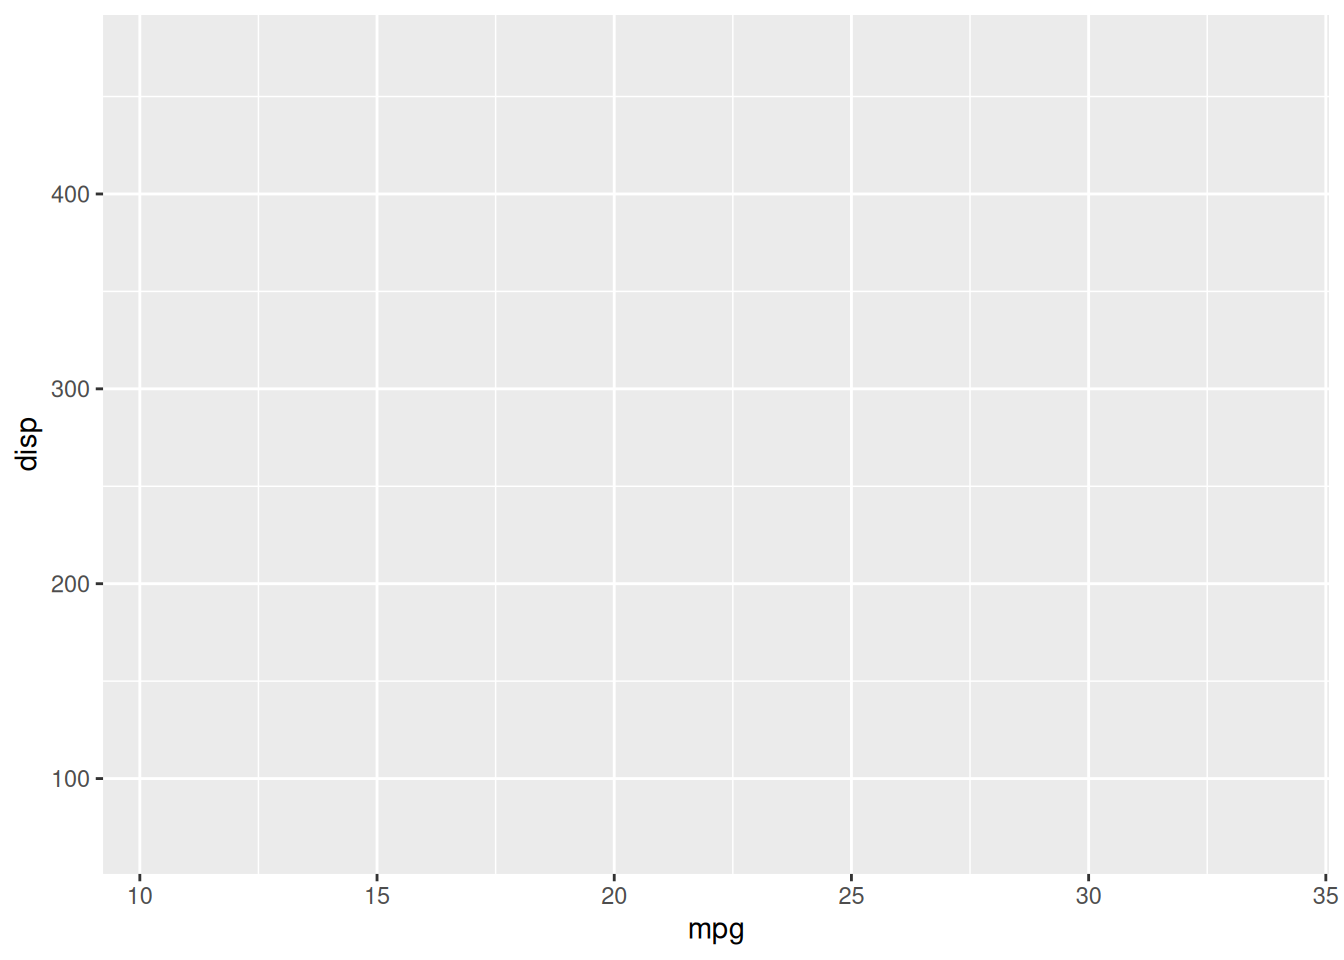
Add a geom to add a layer.
ggplot(data = mtcars, mapping = aes(x = mpg, y = disp)) +
geom_point()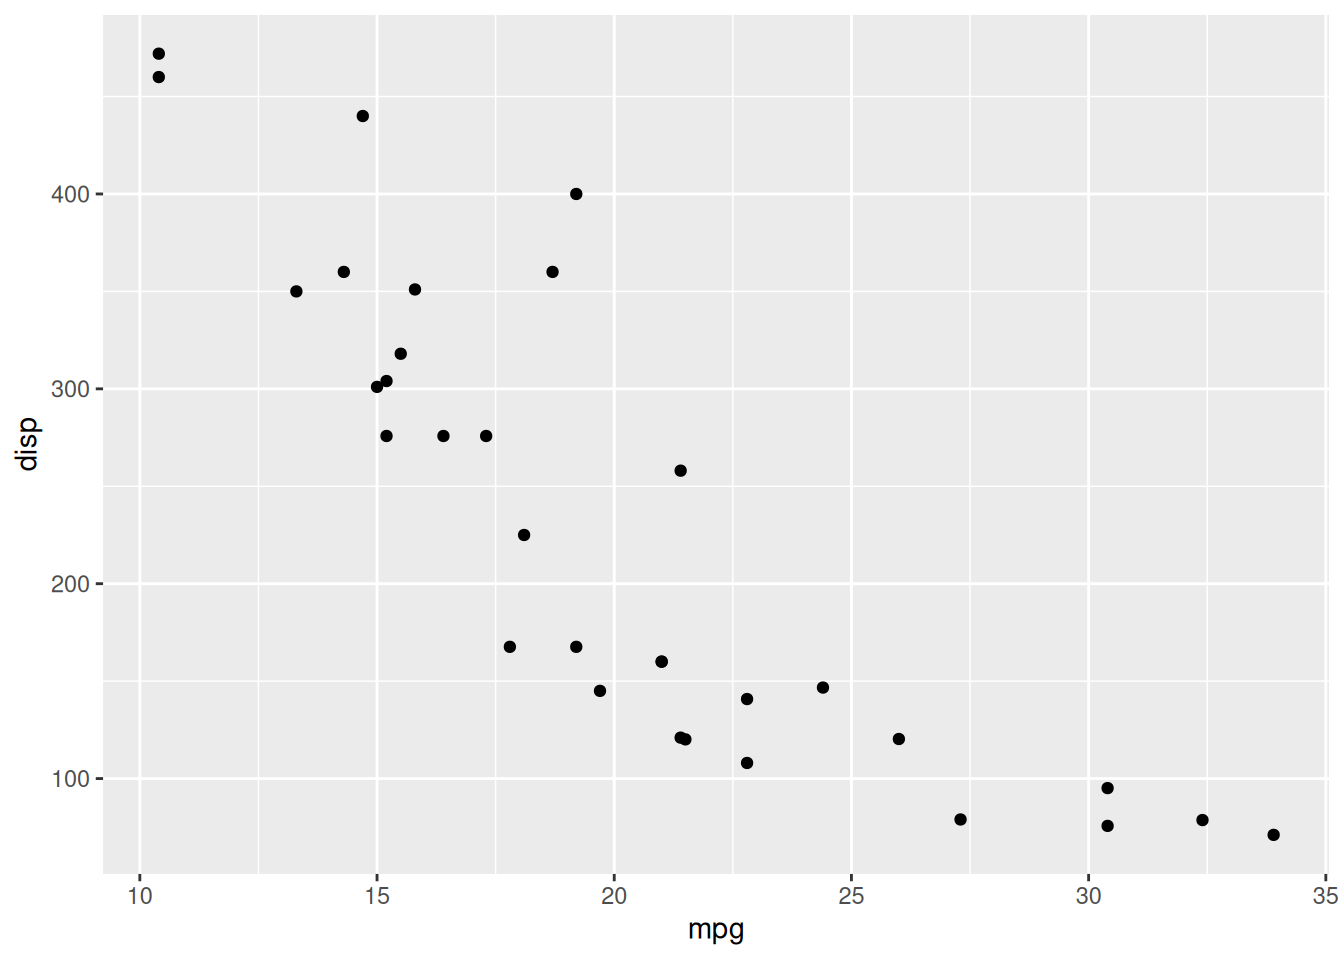
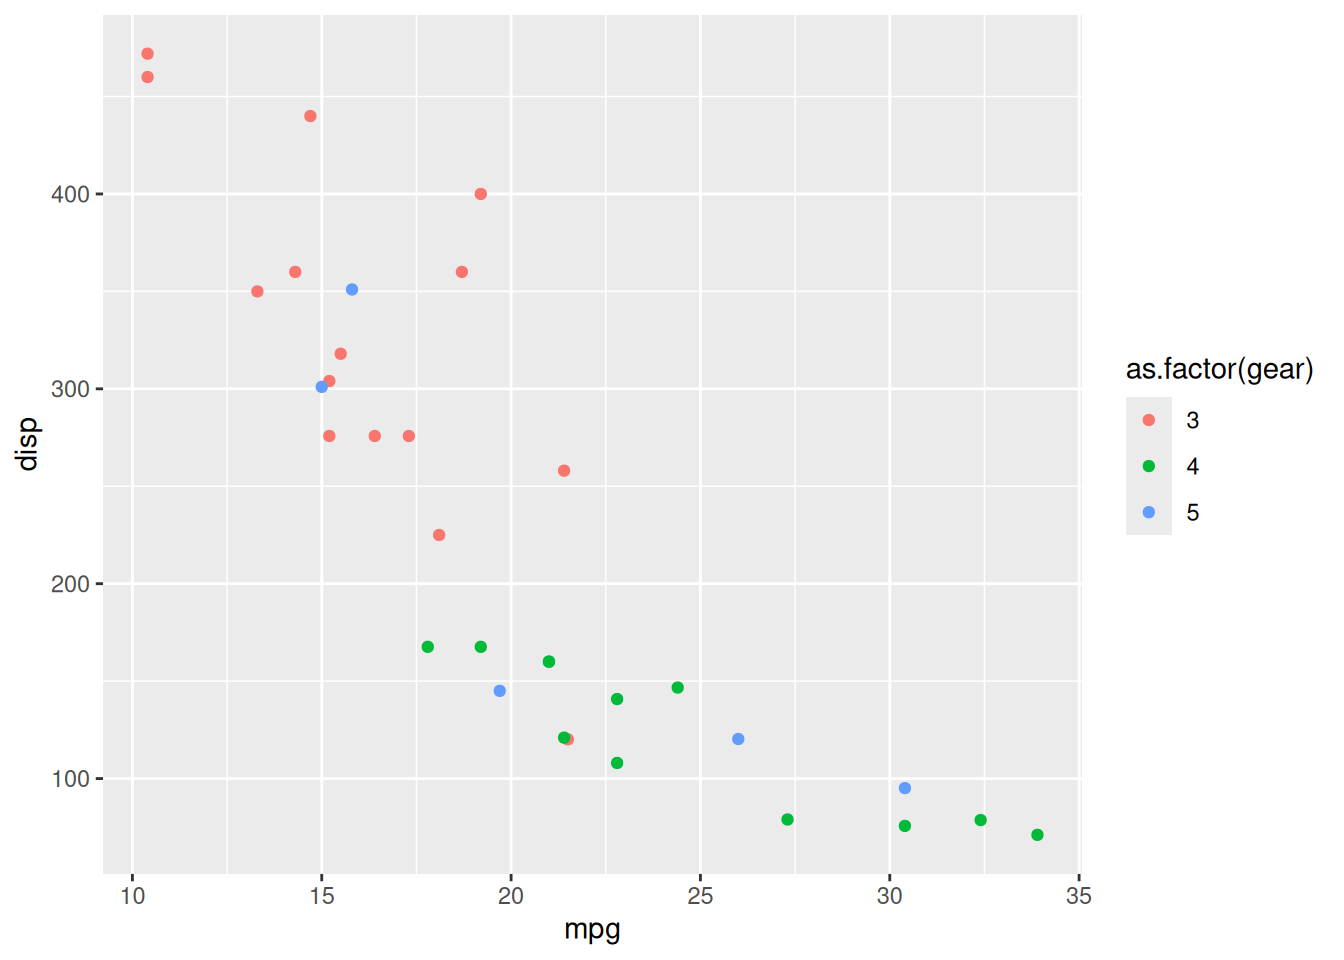
Add colors based on a variable
ggplot(data = mtcars, mapping = aes(x = mpg, y = disp, colour = as.factor(gear))) +
geom_point()